Introduction
Monitoring memory usage and per-process memory allocation is crucial for ensuring your server has enough resources to handle traffic and maintain performance. For instance, a web server needs sufficient memory to serve visitors; otherwise, it might slow down or even go offline during high traffic. The vmstat and free commands are essential tools in Linux for checking memory allocation and usage. This tutorial, based on Ubuntu 16.04, is applicable to other Debian and Ubuntu distributions provided by VPS SELL.
Update System
Begin by updating your server with:
apt-get update

Using the free Command
The free command offers a straightforward way to check memory usage. By default, it shows memory statistics in Kilobytes:
free
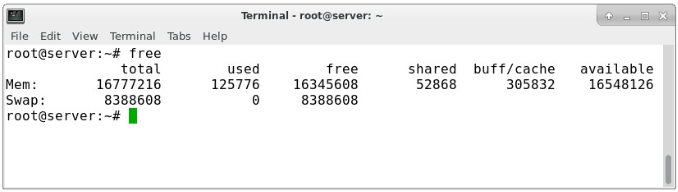
-Some key points about the free command output are:
- By default, all numbers are shown in Kilobytes (KB), but you can customize this (details below).
- The "shared" column is outdated and no longer relevant, as noted in the
free man page.
- The output provides details on memory sizes and allocation for both RAM and swap, including how much of the RAM is used for buffering and caching by applications.
The free command includes several useful options for viewing the output in different units:
-b - Displays the output in Bytes-k - Displays the output in Kilobytes-m - Displays the output in Megabytes-g - Displays the output in Gigabytes--tera - Displays the output in Terabytes-h - Displays the output in a human-readable format (e.g., 1.5M)-t - Adds a total row to the output
To display in a more readable format, we can pass the "-m" option to display the output in megabytes:
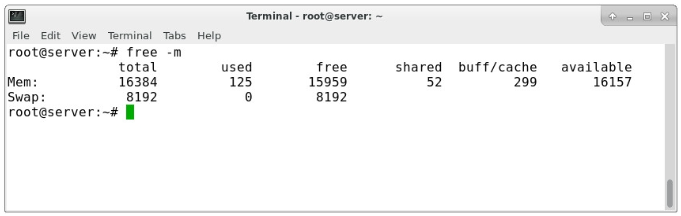
The -m option displays all data in Megabytes (MB). For example, if the total is 16,384 MB, it indicates 16 GB of installed RAM. The "used" column shows the amount of RAM currently used by Linux, such as 124 MB in this case. This output is straightforward: Linux often retains data in memory to improve performance, which can be freed up as needed. The final line of the output represents swap memory, which, in this instance, is completely unused.

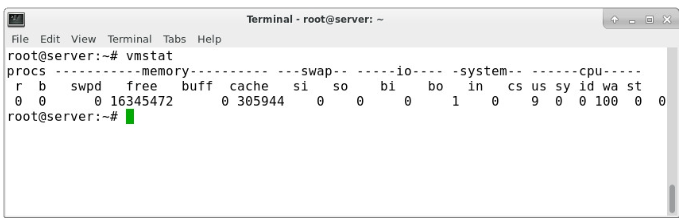
vmstat (virtual memory statistics) is a system monitoring tool that provides a summary of operating system memory, processes, interrupts, paging, and block I/O. It allows users to specify a sampling interval to observe system activity in near real-time. To get an overview of memory usage, simply run:
vmstat
We can see this in megabytes by choosing our unit with the "-S" flag:
vmstat -S M
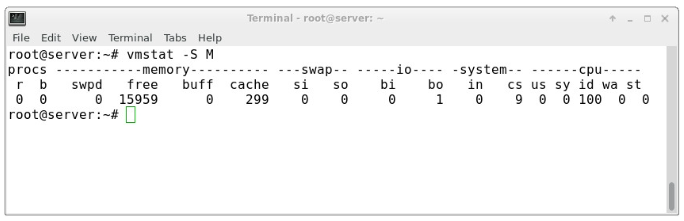
This tool helps to break down the "-/+ buffers/cache" category shown by the free command, giving insights into how memory is allocated for buffering versus caching.
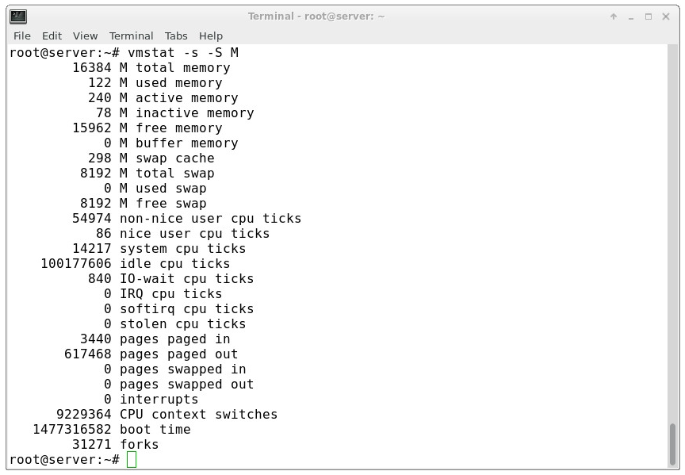
To obtain detailed statistics about memory usage, including these metrics, you can use:
vmstat -s -S M