In your client area, you can view various server graphs that provide insights into daily, weekly, monthly, and annual data. The following types of graphs are available:
- Traffic
- Netpps (Network Packets Per Second)
- CPU
- Load
- I/O (Input/Output)
- IOPS (Input/Output Operations Per Second)
- Memory
- Storage
Resource measurement data is presented in three values:
- Current: The last recorded value.
- Average: The average value over the given period.
- Maximum: The highest recorded value.
Traffic
This chart provides information about the incoming and outgoing traffic to and from the server. Traffic data is measured in bits per second (kbit/s, Mbit/s, Gbit/s).
Daily Graph Example:
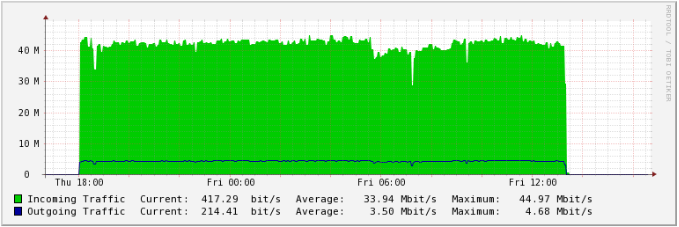
- Maximum daily outgoing traffic: 4.68 Mbit/s
- Maximum daily incoming traffic: 44.97 Mbit/s
Weekly Graph Example:
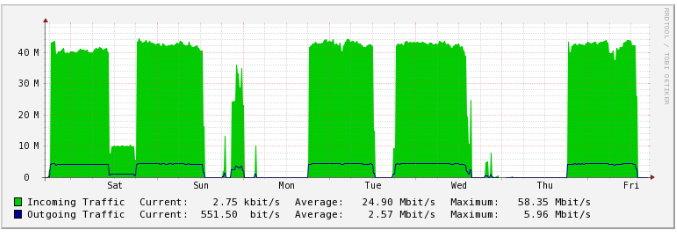
- Maximum weekly outgoing traffic: 5.96 Mbit/s
- Maximum weekly incoming traffic: 58.35 Mbit/s
Netpps (Network Packets Per Second)
This chart shows the number of packets traveling to and from the server, measured in packets per second (p/s).
Daily Graph Example:
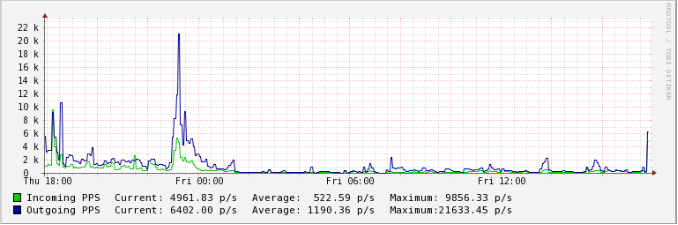
- Maximum outgoing packets: 21,633.45 p/s
- Maximum incoming packets: 9,856.33 p/s
Weekly Graph Example:
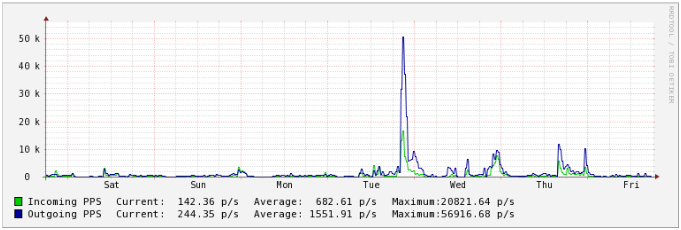
- Maximum outgoing packets: 56,916.86 p/s
- Maximum incoming packets: 20,821.54 p/s
CPU
This graph displays the percentage of CPU load on the server.
- User CPU: Time spent running user-initiated processes (e.g., PHP, Apache, MySQL).
- Nice CPU: Time spent on low-priority processes.
- System CPU: Time spent on system-initiated processes.
- Iowait CPU: Time waiting for I/O operations.
- Idle CPU: Time when the processor is idle.
Daily Graph Example:
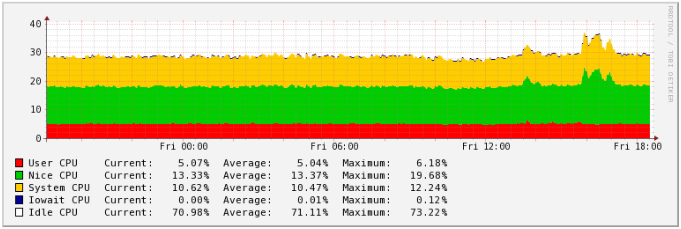
- Maximum time on low-priority processes: 19.68%
- Maximum time on system processes: 12.24%
- Maximum time on user processes: 6.18%
Weekly Graph Example:
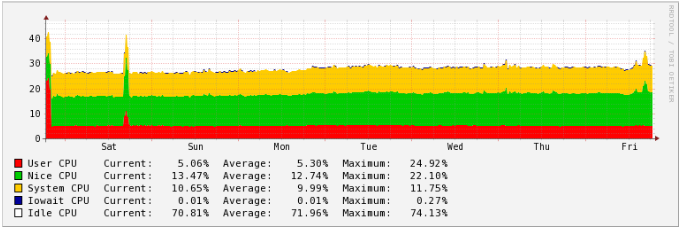
- Maximum time on user processes: 24.92%
- Maximum time on low-priority processes: 22.10%
- Maximum time on system processes: 11.75%
Load
This graph indicates the CPU load condition, showing the average load over 1 and 5 minutes.
Daily Graph Example:
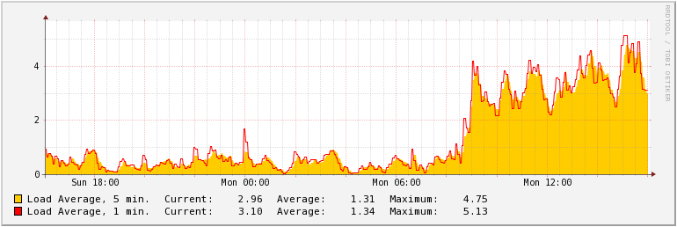
- Maximum 5-minute load average: 5.13
Weekly Graph Example:
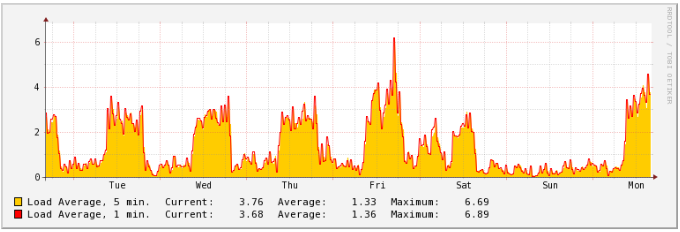
- Maximum 5-minute load average: 5.71
You can find more information about the CPU load indicator here.
I/O
The I/O graph shows disk read and write operations performed by the server, measured in bytes per second (B/s, kB/s, MB/s).
Daily Graph Example:
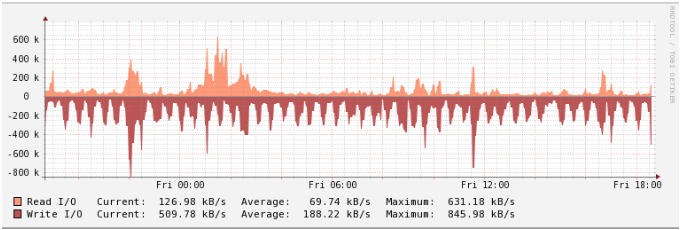
- Maximum disk write: 845.98 kB/s
- Maximum disk read: 631.18 kB/s
Weekly Graph Example:
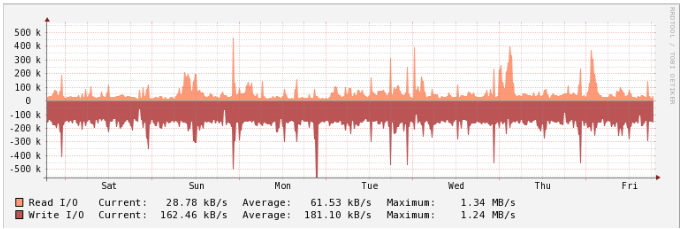
- Maximum disk write: 1.34 MB/s
- Maximum disk read: 1.24 MB/s
IOPS
This chart shows the number of disk read and write operations per second (io/s).
Daily Graph Example:
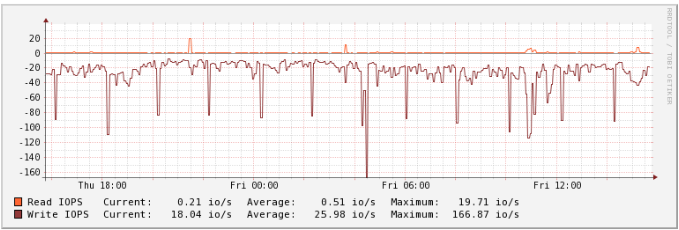
- Maximum write operations: 166.87 io/s
- Maximum read operations: 19.71 io/s
Weekly Graph Example:
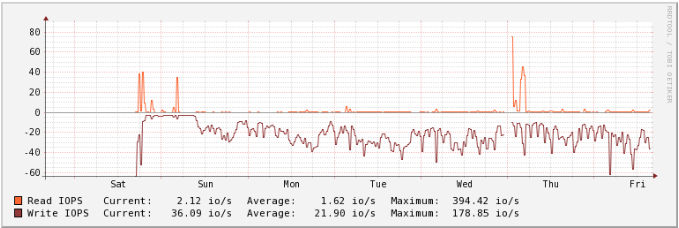
- Maximum write operations: 178.85 io/s
- Maximum read operations: 394.42 io/s
Memory
This graph displays the server's RAM usage.
- Used Memory: Total used memory.
- Active Memory: Memory currently in use.
- Active Swap: Swap memory in use.
Daily Graph Example:
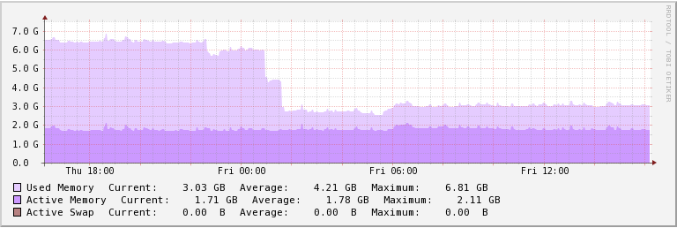
- Current used memory: 3.03 GB
- Current active memory: 1.71 GB
- Active swap: 0.00 B
Weekly Graph Example:
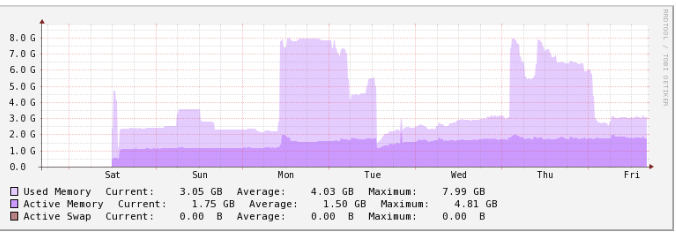
- Maximum used memory: 7.99 GB
- Maximum active memory: 4.81 GB
For more detailed information on RAM, see check out this page.
Storage
This graph shows the server's disk space usage.
Daily Graph Example:
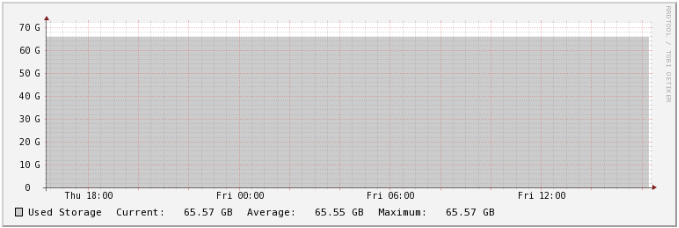
- Current used storage: 65.57 GB
Weekly Graph Example:
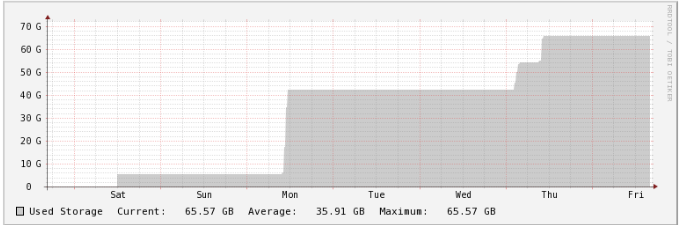
- The graph illustrates how disk storage usage increased over the week.
For more detailed information on each graph, refer to the respective documentation or help pages provided in your client area.